Rating Methodology
Comprehensive framework for evaluating investment opportunities through quantitative analysis and market dynamics
Overview
PriceTarget Research's Value Trend Ratings — quantitative ratings of relative attraction — for 6,000 stocks are updated weekly. These Value Trend Ratings combine a stock's current appreciation potential as reflected in its Appreciation Score and current market dynamics as measured by its Power Rating.
Our rating methodology recognizes two realities. First, as fundamentally based and meaningful as the Price Target and resulting Appreciation Score are, the underlying forecasts can be "off the mark" in some cases. Second, as important as technical measures and the Power Rating can be for a company, they can sometimes carry too far, "overshooting" warranted value, and resulting in an unusually speculative investment.
Rating Framework
By combining deep fundamentals and market factors, the Appreciation Score acts as a "governor" on the Power Rating during periods of high investor enthusiasm and the Power Rating can signal caution when market attitudes are out of line with forecasts and the Appreciation Score.
Value Trend Rating
PTR's Value Trend Rating is a letter grade derived from the combination of the Appreciation Score and Power Rating. Stocks rated as A (Highest Rating) and B (Positive Rating) — 15% of the universe in each case — generally have high Appreciation Scores and high Power Ratings and are expected to outperform the general market over the following 12–24 months. Those rated F (Lowest Rating) and D (Negative Rating) (15% each) are expected to under perform the general market and generally have lower Appreciation Scores and Power Ratings. Stocks rated C (Neutral Rating and 40% of the universe) are anticipated to perform in line with the general market.
| Rating | Description | % of Universe | Anticipated Future Performance |
|---|---|---|---|
| A | (Highest Rating) | 15% | Strongly Outperform |
| B | (Positive) | 15% | Outperform |
| C | (Neutral) | 40% | Neutral |
| D | (Negative) | 15% | Underperform |
| F | (Lowest Rating) | 15% | Strongly Underperform |
Appreciation Score
The Appreciation Score represents the degree to which a stock is attractively priced relative to the universe. Each company's warranted market value — or Price Target — is derived from PTR forecasts of return on equity, long term growth, and cost of capital. The percentage change from the stock's current price to the Price Target is calculated and percentiled relative to the universe (0=the lowest appreciation potential; 100=highest).
- Price Target is $115
- Current Price is $63.50
- Appreciation Potential = $115 / $63.50 = +81.1%
- Resulting Appreciation Score = 84 (%ile rank when compared to the universe)
Power Rating
The Power Rating measures the "timeliness" of a stock for purchase. Because the Price Target, appreciation potential, and Appreciation Score are forecasts, other information is used to serve either as confirmation of the Price Target or to highlight cases in which the forecasts are not credible. It includes the stock's price performance, behavior of other companies in the same industry group, and the trend in earnings expectations. Percentiled relative to a universe of 6,000 companies. 0=the lowest power rating; 100=highest. In the case below the weak Price and Industry Scores offset the higher Earnings Score resulting in a mediocre Power Rating of 34.
The Power Rating incorporates:
- Price Score: Recent stock price performance relative to market
- Earnings Score: Trend in earnings estimate revisions
- Industry Score: Performance of industry group peers
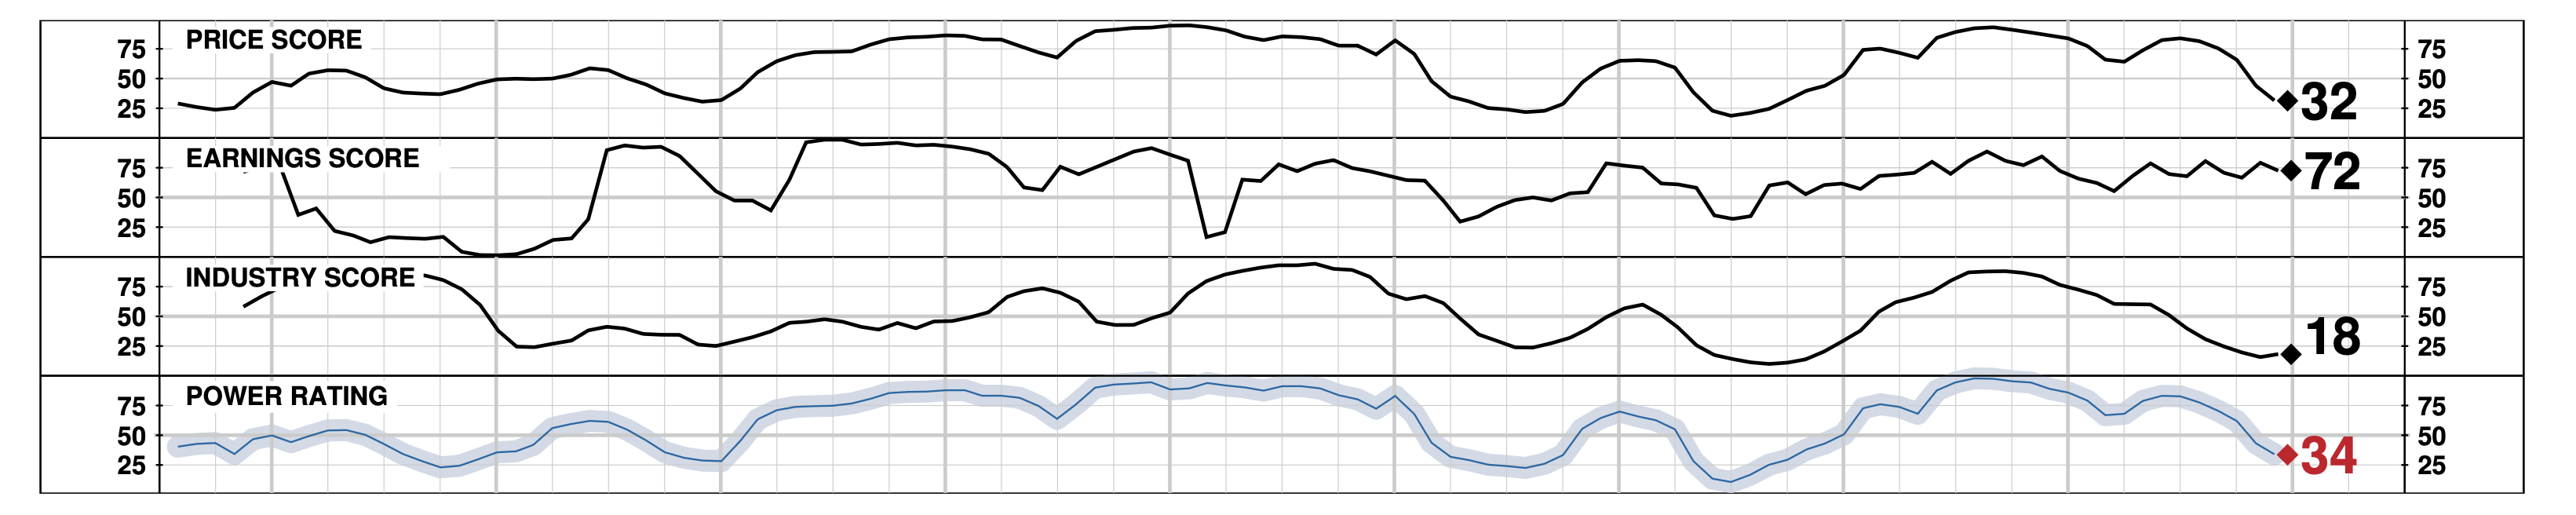
Example showing how Price Score, Earnings Score, and Industry Score combine to create the overall Power Rating
Rating Results
In addition to the regular publication of its stock ratings, PriceTarget Research constantly assesses how well the Value Trend Ratings perform over prior periods. Performance for each rating category and the overall universe is measured over longer historical periods as well as for shorter intermediate periods with the focus on three key aspects of performance:
Performance Measurement Criteria
- Discriminating Performance: How well the ratings discriminate between outperforming and underperforming stocks — i.e., whether high rated stocks outperform the universe and low rated stocks underperform.
- Well-Ordered Results: Whether A-rated stocks outperform B-rated stocks, which in turn, outperform C-rated stocks, and so on.
- Persistence of Ratings: The likelihood that a specific rating (A, B, C, D, or F) is sustained over future periods.
While past performance is no guarantee of future results, the evidence continues to indicate that PTR's Overall Rating discriminates well between stocks that outperformed and stocks that underperformed over historical time periods. Moreover, this performance was well-ordered and consistently superior from period to period. In most years, A-rated stocks outperformed Cs and C-rated stocks outperformed Fs. Finally, the Value Trend Rating provided an exploitable, persistent appraisal of relative attractiveness: the average duration of individual ratings exceeded 12 months.
For a PDF report on the Investment Performance of PriceTarget Research's Stock Ratings, please see: http://www.pricetargetresearch.com/backgroundstats.jsp